Gold price
The usual benchmark for the price of gold is known as the London Gold Fixing, a twice-daily (telephone) meeting of representatives from five bullion-trading firms. Furthermore, there is active gold trading based on the intra-day spot price, derived from gold-trading markets around the world as they open and close throughout the day.
The following table sets forth the gold price versus various investments and key statistics (Note: the prices on the following table and graphs are expressed in terms of nominal dollars, and thus are not adjusted for inflation):
Year to
31st
Dec. |
Gold Price
(US$/oz) |
Silver Price
(US$/oz) |
S&P 500 [1] |
Dow Jones
Industrial
Average [2] |
Money
Supply M3 [3]
(US$ bn) |
Average US
Farm Wages [4]
(US$/hr) |
US Govt Debt [5]
(US$ billions) |
| |
(adjusted to
2006 dollar)[6] |
|
(adjusted to
2006 dollar)[7] |
| 1910 |
20.67 |
421.84 |
0.54 |
11.02 |
|
59.60 |
|
|
2.6 |
| 1920 |
20.67 |
208.79 |
0.54 |
5.45 |
|
71.95 |
|
|
25.9 |
| 1930 |
20.67 |
249.04 |
0.33 |
3.98 |
|
164.58 |
|
|
16.2 |
| 1940 |
34.50 |
500.00 |
0.35 |
5.07 |
|
131.13 |
|
|
43.0 |
| 1950 |
40.25 |
335.42 |
0.80 |
6.67 |
|
235.42 |
|
|
257.4 |
| 1960 |
36.50 |
248.30 |
0.91 |
6.19 |
58.11 |
615.89 |
315.2 |
|
290.2 |
| 1970 |
37.60 |
195.83 |
1.64 |
8.54 |
92.15 |
838.92 |
677.1 |
|
389.2 |
| 1980 |
641.20 |
1567.73 |
15.65 |
38.26 |
135.76 |
963.99 |
1,995.5 |
3.50 |
930.2 |
| 1990 |
423.80 |
654.01 |
4.17 |
6.44 |
330.22 |
2,633.66 |
4,154.6 |
5.52 |
3,233.3 |
| 2000 |
272.15 |
318.68 |
4.60 |
5.39 |
1,320.28 |
10,786.85 |
7,117.7 |
8.10 |
5,674.2 |
| 2005 |
513.00 |
529.41 |
8.83 |
9.11 |
1,248.29 |
10,717.50 |
10,191.4 |
9.51 |
8,170.4 |
| 2008 |
1,002.00 |
790.40 |
14.59 |
14.29 |
1,288.14 |
11,869.65 |
Undisclosed |
9.87 |
9,090.9 |
Factors influencing the gold price
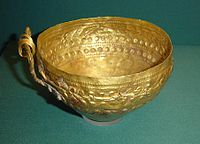
This ancient Egyptian golden bowl was buried in the tomb of a pharaoh and today sits in the British Museum. Gold items were often buried with pharaohs to use in the after-life, because gold is free from corrosion or decay.
Today, like all investments and commodities, the price of gold is ultimately driven by supply and demand, including hoarding and disposal. Unlike most other commodities, the hoarding and disposal plays a much bigger role in affecting the price, because most of the gold ever mined still exists and is potentially able to come on to the market for the right price. [8] [9] Given the huge quantity of hoarded gold, compared to the annual production, the price of gold is mainly affected by changes in sentiment, rather than changes in annual production.[10]
According to the World Gold Council, annual mine production of gold over the last few years has been close to 2,500 tonnes. [11] About 3,000 tonnes goes into jewelry or industrial/dental production, and around 500 tonnes goes to retail investors and exchange traded gold funds. [11] This translates to an annual demand for gold to be 1000 tonnes in excess over mine production which has come from central bank sales and other disposal. [11]
Central banks and the International Monetary Fund play an important role in the gold price. At the end of 2004 central banks and official organizations held 19 percent of all above-ground gold as official gold reserves [12]. The Washington Agreement on Gold (WAG), which dates from September 1999, limits gold sales by its members (Europe, United States, Japan, Australia, Bank for International Settlements and the International Monetary Fund) to less than 400 tonnes a year [13]. European central banks, such as the Bank of England and Swiss National Bank, have been key sellers of gold over this period [14].
Although central banks do not generally announce gold purchases in advance, some, such as Russia, have expressed interest in growing their gold reserves again as of late 2005 [15]. In early 2006, China, which only holds 1.3% of its reserves in gold [16], announced that it was looking for ways to improve the returns on its official reserves. Many bulls hope that this signals that China might reposition more of its holdings into gold in line with other Central Banks. [17]

Inflation 1923-24: A woman in Germany feeds her tiled stove with money. The money was worth less than firewood.

A 500,000,000,000 (500 billion) Yugoslavia dinar banknote circa 1993, the largest nominal value ever officially printed in Yugoslavia, the final result of hyperinflation. Photo courtesy of National Bank of Serbia.
In general, gold becomes more desirable in times of:
- Bank failures
- When dollars were fully convertible into gold, both were regarded as money. However, most people preferred to carry around paper banknotes rather than the somewhat heavier and less divisible gold coins. If people feared their bank would fail, a bank run might have been the result. This is what happened in the USA during the Great Depression of the 1930s, leading President Roosevelt to impose a national emergency and to outlaw the holding of gold by US citizens. [18] known as Executive Order 6102 which has since been ended.
- Low or negative real interest rates
- If the return on bonds, equities and real estate is not adequately compensating for risk and inflation then the demand for gold and other alternative investments such as commodities increases. An example of this is the period of Stagflation that occurred during the 1970s and which led to an economic bubble forming in precious metals.[19][20][21][22][23][24]
- War, invasion, looting, crisis
- In times of national crisis, people fear that their assets may be seized and that the currency may become worthless. They see gold as a solid asset which will always buy food or transportation. Thus in times of great uncertainty, particularly when war is feared, the demand for gold rises. [25] [26]
Anti-trust litigation
The Gold Anti-Trust Action Committee was organized in January 1999 to advocate and undertake litigation against illegal collusion to control the price and supply of gold and related financial securities. GATA underwrote the federal anti-trust lawsuit of its consultant, Reginald H. Howe -- Howe vs. Bank for International Settlements et al. -- which was pursued in U.S. District Court in Boston from 2000 to 2002. While the Howe suit was dismissed on a jurisdictional technicality, it became the model for Blanchard Coin and Bullion's anti-trust lawsuit against Barrick Gold and J.P. Morgan Chase & Co., which was filed in U.S. District Court in New Orleans in 2002 and prompted Barrick Gold's decision to stop selling gold in advance for 10 years. [27]
Types of gold investor
Investors may buy gold for a variety of reasons: among them include a desire to diversify their assets;[28][29][30][31][32] to hide wealth from tax authorities; for reasons of political belief (e.g. libertarian); or out of fear of an economic depression or other serious crisis.
] Methods of investing in gold
-
Main article: Methods of investing in gold
Investment in gold can be done directly through bullion ownership, or indirectly through certificates, accounts, spread betting, derivatives or shares.
Investment strategies
Fundamental analysis

One troy ounce along with the certificate
Investors using fundamental analysis analyze the macroeconomic situation, which includes international economic indicators, such as GDP growth rates, inflation, interest rates, productivity and energy prices. They would also analyze the total global gold supply versus demand. Over 2005 the World Gold Council estimated total global gold supply to be 3,859 tonnes and demand to be 3,754 tonnes, giving a surplus of 105 tonnes [11]. Others point out that total mine production is only about 2,500 tonnes each year, leaving a 1,300 tonne deficit that must be made up by central bank or private sales.[33]. While gold production is unlikely to change in the near future, supply and demand due to private ownership is highly liquid and subject to rapid changes. This makes gold very different from almost every other commodity.[8] [9]
Gold versus stocks
The ratio of the Dow Jones Industrial Average index divided by the price of an ounce of gold. A surrogate index was used to generate all points before 1897. Note that this chart does not account for dividend reinvestment or tax consequences. Chart provided by www.sharelynx.com
The performance of gold bullion is often compared to stocks. They are fundamentally different asset classes: gold is a store of value whereas stocks are a return on value (i.e. growth plus dividends). Stocks and bonds perform best in a stable political climate with strong property rights and little turmoil. The attached graph shows the value of Dow Jones Industrial Average divided by the price of an ounce of gold. Since 1800, stocks have consistently gained value in comparison to gold due in part to the stability of the American political system. [34]This appreciation has been cyclical with long periods of stock outperformance followed by long periods of gold outperformance. The Dow Industrials bottomed out a ratio of 1:1 with gold during 1980 (the end of the 1970s bear market) and proceeded to post gains throughout the 1980s and 1990s. The ratio peaked on January 14th, 2000 a value of 41.3 and has fallen sharply since. William Anton III wrote in the 2004 issue of Jefferson Coin and Bullion "...downward movement in the Dow/gold ratio is unlikely to stop precisely at the mean trendline. The extreme distension of the the 90s will likely overshoot to the opposite extreme in the current cycle." Source: [12] [13] [14] [15]
In November 2005, Rick Munarriz of Motley Fool.com posed the question of which represented a better investment: a share of Google or an ounce of gold. The specific comparison between these two very different investments seems to have captured the imagination of many in the investment commuity and is serving to crystalize the broader debate. Source: [16] [17] At the time of writing, a share of Google's stock and an ounce of gold were both near $700. On January 4, 2008 23:58 New York Time, it was reported that an ounce of gold outpaced the share price of Google by 30.77%, with gold closing at $859.19 per ounce and a share of Google closing at $657 on U.S. market exchanges. On January 24th 2008, the gold price broke the $900 mark per ounce for the first time. The price of gold topped $1,000 an ounce for the first time ever on March 13, 2008 amid recession fears in the United States.[35]
Technical analysis
As with stocks, gold investors may base their investment decision partly on, or solely on, technical analysis. Typically, this involves analyzing chart patterns, moving averages, market trends and/or the economic cycle in order to speculate on the future price.
Using leverage
Bullish investors may choose to leverage their position by borrowing money against their existing gold assets and then purchasing more gold on account with the loaned funds. In order to keep the cost of debt to a minimum, these individuals would normally seek a loan in the currency with the lowest borrowing rate, which, as of April 2006, was the Japanese yen. This technique is referred to as a "yen-gold carry trade". Leverage may increase investment gains but increases risk, as, if the gold price decreases, the investor may be subject to a margin call. Leverage is also an integral part of buying gold derivatives and unhedged gold mining company shares (see gold mining companies).
Gold's value versus money supply
|
|
To comply with Wikipedia's quality standards, this article may need to be rewritten.
Please help improve this article. The discussion page may contain suggestions. |
Price of gold since 1968 (actual and inflation-adjusted)
For many years, the dollar was pegged to the gold standard.
Historically, increases in the supply of fiat currency through increased money supply have caused the demand for gold to increase. There was a time when gold was money and vice versa. If citizens felt that there may be insufficient gold to cover the paper money in circulation, they would queue up at the bank to change their paper currency back into gold.
However, since the gold standard was ended on August 15, 1971, governments have been free to print as much money as they choose, without fear that their populations will come knocking on the central bank's door demanding to change their paper money back into gold.
In January 1959 US M3 money supply was $288.8 billion [18], and the official gold reserves of the United States was then 17,335.1 tonnes, or 557,336,000 ounces [19] (there are 32,150.7 troy ounces in a tonne). That means that in 1959, there were $518 in circulation for every ounce of gold reserves held by the USA. Although the actual ratio of dollars to gold was $518 per ounce, the actual price, as fixed under the gold standard, was only $35 an ounce.
By August 2005, the US M3 money supply had risen to $9,873.9 billion, whilst at the same time the Official Gold Holdings of the United States had fallen to just 8,133.5 tonnes, or 261.50 million Troy Ounces [20]. This means that by 2005, there were $37,831 in circulation for every troy ounce of gold held by the United States.
However, this increase of 75 times in the ratio of central bank gold holdings to debt does not allow for the fact that the gold standard was abandoned in 1971 and gold holdings have been deliberately and considerably reduced. Another far less dramatic way of looking at the same figures is this: In 1959 US government debt valued in gold was 8 billion Troy ounces, in 2005 US government debt was 20 billion ounces gold - an increase of 2.5 times!
The US Federal Reserve ceased publishing M3 data on 23 March 2006, with the last published data indicating a year-on-year growth rate of 8.23%. Central banks may see this as a reason to limit further increases in their reserves of dollars, and thus alternatives such as gold or the euro might be considered.[citation needed] Jon Nadler, an analyst at Kitco Bullion Dealers, said gold was still benefiting from August 30, 2006 release of the minutes to the last rate-setting meeting of the US Federal Reserve. The minutes to the August 8, 2006 meeting, at which the Federal Open Market Committee kept short-term interest rates unchanged for the first time since 2004, supported the view that US borrowing costs have peaked.[21]
Bulls versus bears
Analysts such as Chuck Saletta argue that while gold may indeed preserve wealth against inflation, it does not present the kind of long term growth potential that stocks do. Saletta goes on to argue that, even if the United States enters a period of high inflation, the stocks of companies involved in consumer staples represent a better investment. [36] The gold price peaked at around $850/oz t ($27,300,000 per tonne) in 1980, and in real terms is still well below that. However, since April 2001 the gold price has more than tripled in value against the US dollar (as seen here), prompting speculation to circulate that this long secular bear market (or the Great Commodities Depression) has ended and a bull market has returned